In recent years, machine learning has played a central role in a variety of fields, from medical diagnostics to financial analysis. However, the widespread adoption of complex models, such as deep neural networks and ensemble algorithms with decision trees, has raised concerns about their comprehensibility and reliability. Two fundamental concepts emerge as a response to these concerns: interpretability and transparency.
But what is interpretability?
Interpretability refers to the ability to understand how and why a machine learning model arrived at a particular prediction or decision.[3] In practical terms, an interpretable model is one whose operations can be analyzed and explained in terms that are clear and intuitive to a human being. There are two methods of interpretability[4]:
Local: Involves explaining specific predictions. For example, why one customer was approved for a loan while another was denied.
Global: Refers to the overall understanding of how the model performs across the entire dataset, including the relationships it has learned between variables.
In this way, we can understand the importance of interpretability: based on trust, as it facilitates the acceptance of AI-based systems by allowing users to understand their decisions; through diagnostics, allowing the identification of errors, biases and areas for improvement in models; and finally in compliance, meeting regulatory transparency requirements in sectors such as healthcare and financial services.
But we cannot forget a complementary pillar, transparency, which is related to the ability to examine the internal structures and functioning of a model. A transparent model is one whose functioning is inherently clear without the need for external tools for interpretation. Examples of transparent models include decision trees, linear regression, and other simple algorithms. In these cases, it is possible to easily visualize how an input is transformed into an output.
In parallel, there are opaque models, which are difficult to understand precisely because of complex internal mechanisms. Some examples are: Deep neural networks, boosting algorithms (combine a set of weak learners into a strong learner) and other complex models.
Well, while interpretability and transparency are desirable, there is often a trade-off between these concepts and model performance. More complex models tend to be more accurate but less interpretable.
And with that, you can understand what XAI (Explainable Artificial Intelligence) is, right?
No? Okay, according to IBM, XAI is a set of processes and methods that enable human users to understand and trust the results and outputs created by ML (Machine Learning) algorithms.[1]
In other words, according to the Wikipedia article, XAI aims to explain what has been done, what is being done, and what will be done next, and to reveal what information these actions are based on. This makes it possible to confirm existing knowledge, challenge existing knowledge, and generate new assumptions.[2]
I want to share four approaches to make the model more interpretable:
- Simple Models: Whenever possible, opt for internally interpretable models, such as decision trees or linear regression.
- Post-Hoc Techniques: In the case of complex models, use tools: SHAP (SHAP (SHapley Additive exPlanations) is based on game theory and calculates the contribution of each feature to the prediction of a model, showing how each variable impacts the output.), LIME (LIME (Local Interpretable Model-agnostic Explanations) approximates the behavior of a complex model with a simpler and more interpretable model (such as linear regression) in a local region, around the prediction that is being explained.), Feature Importance (The Feature Importance method assigns a score to each variable, indicating how relevant it is to the model in its task, and can be calculated in different ways depending on the model.), Interpret (The Interpret library offers a range of interpretable models, including EBM, which allows obtaining global and local explanations about the model’s behavior.) and others.
- Visualizations: Use charts and dashboards to present explanations intuitively.
- Documentation: Record the entire decision-making process of the model and also the assumptions made during training.
How about seeing some code?
In the examples I used Google Colab, which can be tested here https://colab.new , I used Kaggle’s Diabetes 2 dataset, which can be downloaded here https://www.kaggle.com/datasets/cjboat/diabetes2
Example code with SHAP [5]
Now, let’s use the SHAP library to understand the importance of each feature in our XGBoost model.
# The environment requires this module to be installed
 !pip install shap
# Import the libraries
import shap
import xgboost as xgb
import numpy as np
import pandas as pd
from sklearn.model_selection import train_test_split # Reading the dataset
 diabetes_data = pd.read_csv( "/content/diabetes.csv" ) # Separating Features and Target Variables
 X = diabetes_data.drop(columns= 'Outcome' )
y = diabetes_data[ 'Outcome' ] # Split the data into training and testing
 X_train, X_test, y_train, y_test = train_test_split(X, y, test_size= 0.2 , random_state= 42 ) # Train a model XGBoost
 model = xgb.XGBRegressor(objective= 'reg:squarederror' , n_estimators= 100 , max_depth= 4 )
model.fit(X_train, y_train) # Create a SHAP object explainer =
shap.Explainer( model ,
In this code, we use the Diabetes 2 dataset to train an XGBoost model. It demonstrates how to use the SHAP library to interpret the model’s predictions, providing insights into the variables that are most important for decision making.
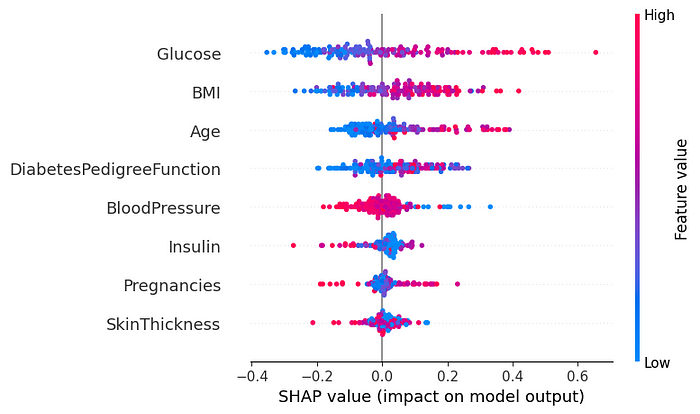
Output of the above code shap.summary_plot
In the SHAP graph, we can see that ‘Glucose’ and ‘BMI’ are the features that most influence the model’s decision.
Code example with LIME [5]
We will now demonstrate how LIME can explain individual predictions from a Random Forest model.
# The environment requires this module to be installed
 !pip install lime
# Import the libraries
import numpy as np
import pandas as pd
import lime
import lime.lime_tabular
from sklearn.ensemble import RandomForestClassifier
from sklearn.model_selection import train_test_split # Reading the dataset
 diabetes_data = pd.read_csv( "/content/diabetes.csv" ) # Separating Features and Target Variables
 X = diabetes_data.drop(columns= 'Outcome' )
y = diabetes_data[ 'Outcome' ] # Split the data into training and testing
 X_train, X_test, y_train, y_test = train_test_split(X, y, test_size= 0.2 , random_state= 42 ) # Train a model Random Forest
 model = RandomForestClassifier(n_estimators= 100 , random_state= 42 )
model.fit(X_train, y_train) # Capturing feature names
 feature_names = list (X_train.columns) # Creating a LIME object
 explainer = LimeTabularExplainer(X_train.values,
    feature_names=feature_names,
    class_names=class_names,
    mode= 'classification'
 ) # Choosing an instance to explain
 instance = X_test.values[ 10 ]
explanation = explainer.explain_instance(instance, model.predict_proba, num_features= 6 ) # View the explanation
 explanation.show_in_notebook(show_table= True )
In this example we use the Diabetes 2 dataset to train a Random Forest model, demonstrating how to apply LIME to generate local explanations for a single test instance.
In the explanation, we can see that features with positive values contributed to the positive prediction, while negative values contributed to the negative prediction.
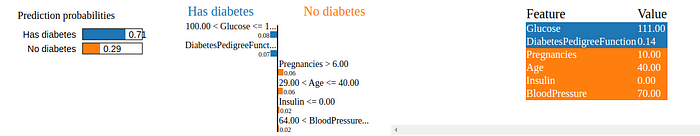
Output of above code explanation.show_in_notebook
explanation.as_list()
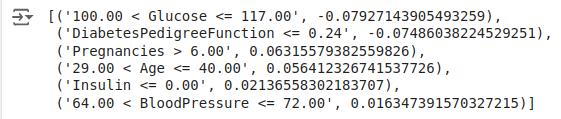
Output of above code explanation.as_list
Code example with Feature Importance
We will use the Feature Importance method to visualize the most relevant variables for the Random Forest model.
# Import the libraries
import numpy as np
import pandas as pd
from sklearn.ensemble import RandomForestRegressor
from sklearn.model_selection import train_test_split
import matplotlib.pyplot as plt
# Reading dataset
 diabetes_data = pd.read_csv( "/content/diabetes.csv" ) # Separating Features and Target Variables
 X = diabetes_data.drop(columns= 'Outcome' )
y = diabetes_data[ 'Outcome' ] # Split the data into training and testing
 X_train, X_test, y_train, y_test = train_test_split(X, y, test_size= 0.2 , random_state= 42 ) # Capturing the feature names
 feature_names = list (X_train.columns) # Training a model Random Forest
 model = RandomForestClassifier(n_estimators= 100 , random_state= 42 )
model.fit(X_train, y_train) # Get the importance of the features
 importances = model.feature_importances_ # Create a DataFrame for visualization
 importance_df = pd.DataFrame({
    'Feature' : feature_names,
    'Importance' : importances
}).sort_values(by= 'Importance' , ascending= False ) # Visualize the importance of the features
 plt.figure(figsize=( 10 , 6 ))
plt.barh(importance_df[ 'Feature' ], importance_df[ 'Importance' ], color= 'skyblue' )
plt.xlabel( 'Importance' )
plt.ylabel( 'Feature' )
plt.title( 'Importance of Features in Random Forest' )
plt.gca().invert_yaxis()
plt.show()
In this example, we use the Diabetes 2 dataset to train a Random Forest model. The code calculates the importance of variables and generates a bar chart to help interpret the results.
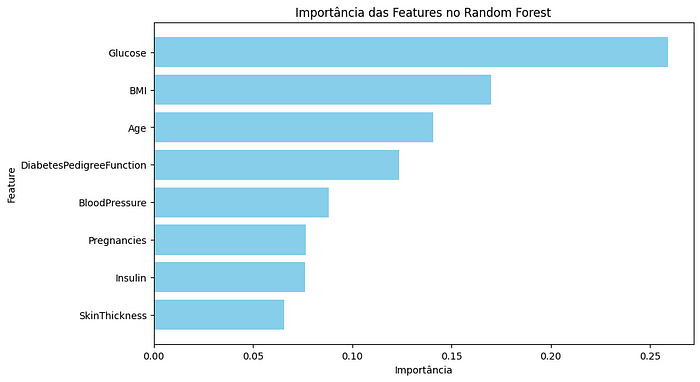
Importance of Features in Random Forest
The Feature Importance graph shows that ‘Glucose’, ‘BMI’ and ‘Age’ are the most important variables for the Random Forest model.
Code example with Interpret
Finally, we will use the Interpret library to create an explainable model and visualize global and local explanations.
# The environment requires this module to be installed
 !pip install interpret
# Import the libraries
import numpy as np
import pandas as pd
from interpret.glassbox import ExplainableBoostingClassifier
from interpret import show # Train a model interpretable
 model = ExplainableBoostingClassifier()
model.fit(X_train, y_train) # Generate explanations
 ebm_global = model.explain_global()
show(ebm_global) # Local explanation for an instance
 instance = X_test.values[ 10 ]
ebm_local = model.explain_local(instance.reshape( 1 , - 1 ), y_test[ 0 : 1 ])
show(ebm_local)
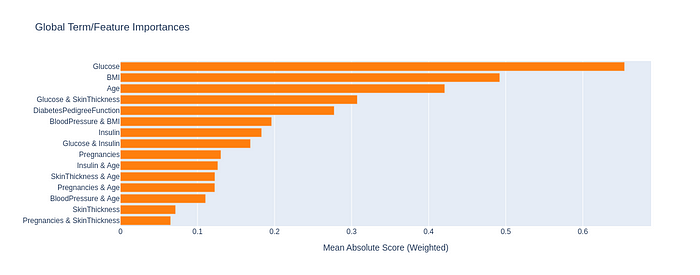
Global Term/Feature Importances
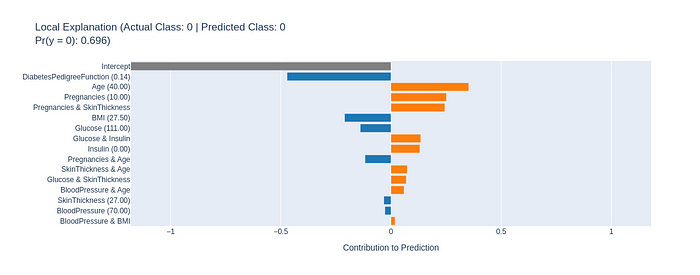
Local Explanation
Conclusion
The effort to create interpretable models is essential to promote trust and ethics in the use of AI. Although there are challenges to be overcome, such as the trade-off between accuracy and interpretability, the future of machine learning certainly involves transparency and the ability to explain its decisions.
Interpretability and transparency are not just technical issues, but also fundamental elements to increase the trust, ethics, and efficiency of machine learning systems. By investing in explainable and transparent models, ML professionals not only improve user acceptance, but also ensure that these systems are aligned with best practices and current regulations.
Explore the tools and techniques presented in this article, seeking not only accuracy but also understanding of your models.
I believe that a promising future for AI involves developing models that we can not only use, but also understand.
References:
[3] https://www.dio.me/articles/interpretabilidade-em-modelos-de-machine-learning
[4] https://www.mathworks.com/discovery/interpretability.html
[5] https://www.datacamp.com/tutorial/explainable-ai-understanding-and-trusting-machine-learning-models
Original Article: https://medium.com/@fertorresfs/interpretability-and-transparency-of-machine-learning-models-b1f169ae582d